
By Nick Reed
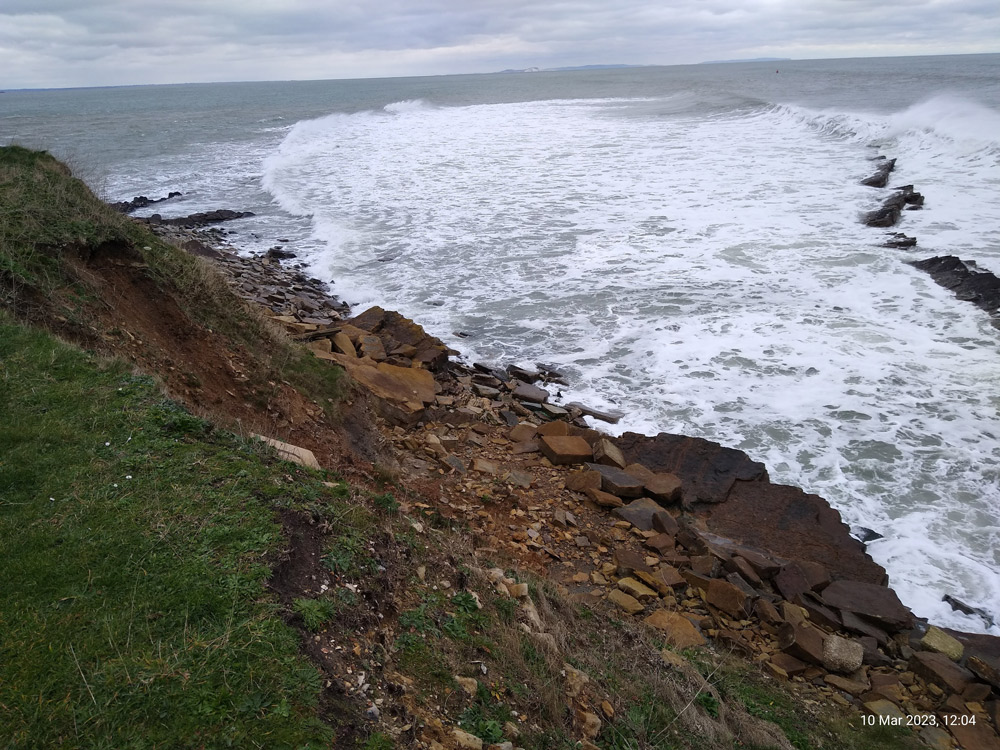
I thought I’d continue the theme of last month’s Purbeck Gazette article and continue to explore tides. As I said, we can use tide tables to generally predict them well in advance. However, every now and then, weather conditions, especially air pressure, create anomalies that mean the tides can differ considerably from what we expect. In early March we had a series of low pressure systems dotted around the UK. These systems brought snow to many parts of the country but, on the south coast, it meant we experienced unusually high tides that didn’t go out very much.
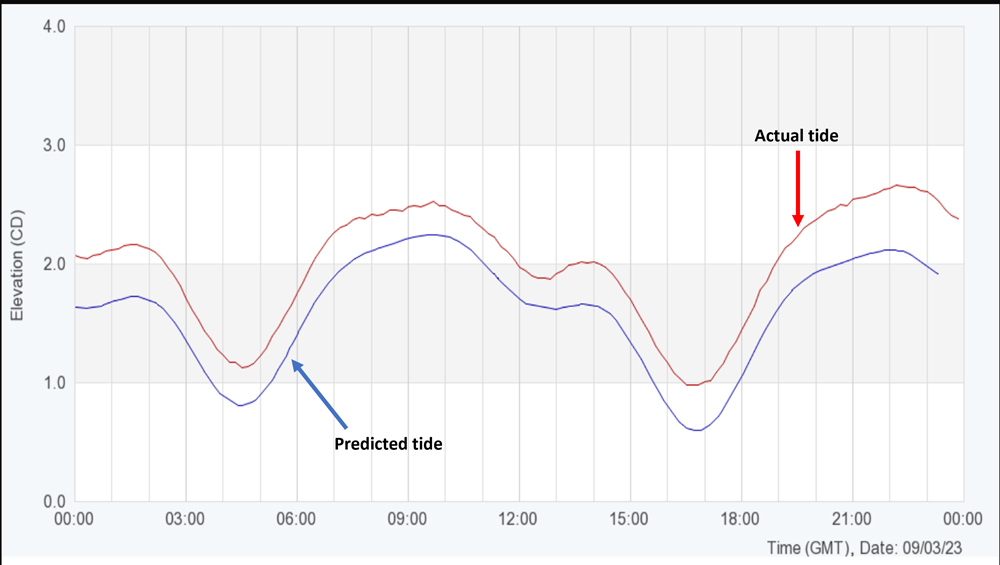
Around March 9 the air pressure dropped to 988 millibars and the evening high tide was over half a metre higher than forecast. The forecast high tide was 2.12 metres and the actual high tide was 2.61 metres. This shows up very clearly on the tide graph taken from the monitoring gauge at the end of Swanage Pier. This is operated by the Channel Coast Observatory (CCO) and uses a radar beam to measure things like depth of water, wave height and wave frequency. The CCO maintains a series of tide gauges and wave buoys along the south coast to help with monitoring sea levels and coastal erosion. All the data is displayed on its website.

The Earth’s atmosphere exerts pressure on the surface of the earth and the ocean. The easiest way of thinking of it is to imagine the air in the atmosphere around us pushing down. There is about one kilogram of air pushing down on every square centimetre of the earth. To help visualise this, a kilogram is a bag of sugar and a square centimetre is the size of our thumb nail. When the pressure is high there is more of a push on the sea, so tides are lower than predicted. Conversely, when there is low pressure, the push is smaller and so the tide is higher.
The following day the air pressure had risen to just over 1000 millibars and the tide was only about 6 centimetres higher than predicted.
To ensure that we are measuring things consistently, we need to measure tides from a fixed point or datum. Most people are familiar with the term ‘height above sea level’ and this makes use of a fixed point from which all land heights are measured. This is known as ordnance datum and is based on a benchmark on the harbour wall at Newlyn in Cornwall. For mariners, a more useful measure is chart datum, and this is what most tides are measured against.
Chart datum is the depth of water at a port based on the lowest astronomical tide, which is the lowest tide possible under usual atmospheric conditions. The LAT – as it is often known – gives a measure of the minimum depth of water in a port or harbour. For Swanage, the chart datum is measured from a point about in the middle of the Bay and would mean a depth of water at the end of Swanage Pier of 2.5 metres. This means that on the evening of March 9 the depth of water would have been about 5.1 metres.
Predicted tides are based on an average air pressure and in the UK tide tables assume a standard pressure of 1013 millibars – more correctly known nowadays as hectopascals or hPA. A one millibar change in pressure will change the sea level by one centimetre. The lowest pressure recorded around the British Isles is about 925 millibars, which would give sea levels nearly a metre above tide table predictions. This can be an important factor in storm surge conditions when the low-lying land is threatened. The highest pressure around the UK is about 1050 millibars which would give sea levels about 40cm lower. For a mariner it’s often this change in predicted tide level, due to high pressure, that is most important as it could mean the difference between clearing an area of shallow water or being able to enter a harbour, without grounding.
In many ways April marks the beginning of the year for us. With Easter, lengthening days and improving weather we see more people on the water and coastal visitors to St Alban’s Head and Peveril Point begin to increase. Both stations will be offering refreshments over the Easter period. The ‘hatch’ will be open at St Alban’s Head between April 7-10 while at Peveril Point tea and cakes will be on offer on April 9 and 10. These events are really important for our fundraising but it’s also really good to chat to people about the work we do. If you’re out over Easter, come up and see us.
We’ll also be offering refreshments over the early spring Bank Holiday weekend, which creeps into the end of April.
For water users, we have our own dedicated radio channel, Channel 65, which you can use to carry out a radio check.
This is St Alban’s Head and Swanage NCI listening on channel 65, NCI out.


Leave a Reply